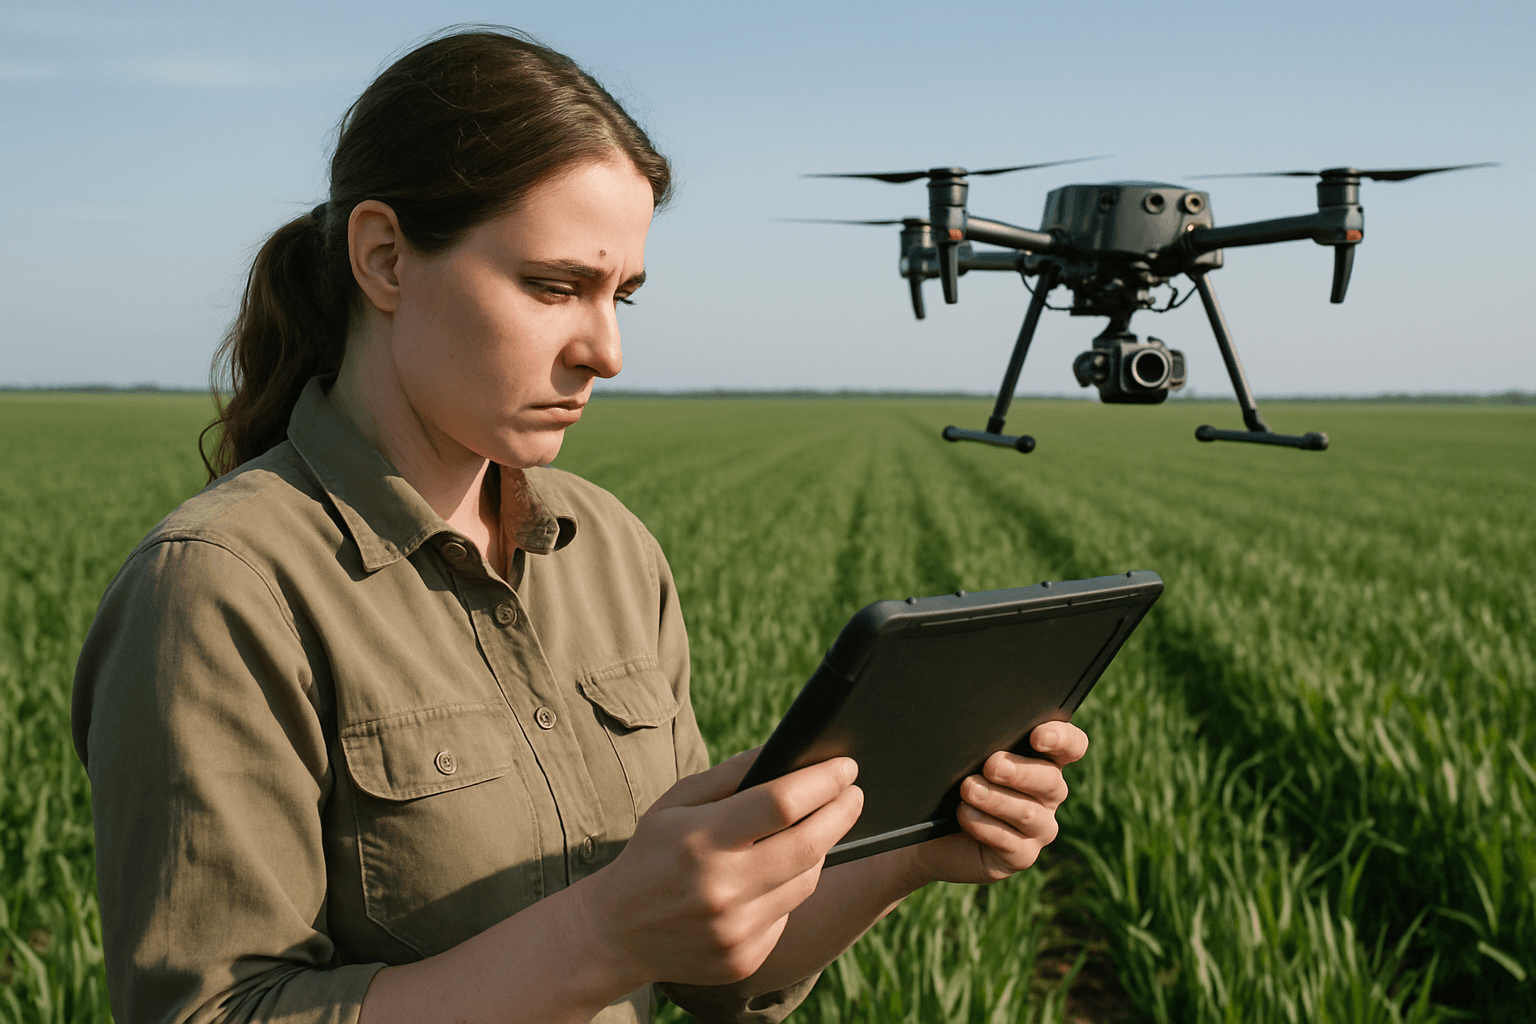
The ability to monitor vegetation health is crucial for a myriad of applications, from optimizing crop yields in precision agriculture to preserving natural ecosystems. Historically, this task involved labor-intensive manual surveys or broad, lower-resolution satellite imagery. However, the advent of drone technology, coupled with advanced spectral imaging sensors, is revolutionizing how we understand and care for our planet’s flora. Drones equipped with multispectral and hyperspectral cameras can capture data invisible to the human eye, providing unprecedented insights into plant vigor, stress, and overall health, enabling timely and informed decisions across various industries.
Understanding Drone Spectral Imaging
Spectral imaging involves capturing and analyzing light reflected from objects across different wavelengths of the electromagnetic spectrum. Unlike standard RGB (Red, Green, Blue) cameras, which mimic human vision, spectral sensors extend into non-visible light, such as Near-Infrared (NIR) and Red Edge, to reveal subtle but critical details about plant health.
What is Spectral Imaging?
Plants interact uniquely with light. Healthy vegetation, for instance, strongly absorbs visible light (especially red and blue wavelengths) for photosynthesis, while robustly reflecting near-infrared (NIR) light. Stressed or unhealthy plants, conversely, reflect more visible light and less NIR. By measuring these specific light reflectance patterns, spectral imaging can create a “spectral signature” for vegetation, allowing for detailed analysis beyond what the naked eye can perceive.
The Role of Drones in Data Acquisition
Drones, or Unmanned Aerial Vehicles (UAVs), provide a flexible, cost-effective, and efficient platform for collecting high-resolution spectral data. Compared to traditional methods or satellite imagery, drones offer superior spatial resolution, allowing for plant-level detail and the ability to cover vast areas quickly. This accessibility and precision make them invaluable tools for applications requiring frequent monitoring and detailed insights.
Multispectral drones typically capture data in 3 to 10 specific, relatively wide spectral bands, including visible light (RGB), Near-Infrared (NIR), and Red Edge. Hyperspectral drones, on the other hand, employ sensors that capture data in hundreds of much narrower, contiguous spectral bands, offering even more detailed information about the composition and characteristics of surfaces. While hyperspectral data provides greater spectral fidelity, it also entails higher cost and more complex processing requirements. For many vegetation health assessments, multispectral imaging strikes an effective balance of detail and practicality.
Key Spectral Bands and Indices for Vegetation Health Assessment
The interaction of plants with different wavelengths of light forms the basis for vegetation health assessment. Specific spectral bands and derived indices are particularly informative.
Visible Light Spectrum (RGB)
While RGB images provide a true-to-life visualization of a field, they are less effective than NIR for distinguishing plant health. Visible light, however, can be useful for human interpretation and some vegetation indices.
Near-Infrared (NIR)
The Near-Infrared (NIR) band (around 700-1100 nm) is critically important for vegetation analysis. Healthy vegetation strongly reflects NIR light due to its internal leaf structure, making this band excellent for monitoring plant vigor and contrasting water bodies.
Red Edge
The Red Edge band (typically 700-750 nm) is a narrow region between the visible red and the near-infrared spectrum. It’s particularly sensitive to changes in chlorophyll content and can detect crop stress and variations in plant health at more advanced stages, as red-edge light can penetrate leaves deeper than red light.
Common Vegetation Indices
Vegetation indices (VIs) are mathematical transformations of two or more spectral bands, designed to enhance specific vegetation characteristics like biomass, photosynthetic activity, and water stress.
- Normalized Difference Vegetation Index (NDVI): The most widely used vegetation index, NDVI, measures photosynthetically active biomass and indicates vegetation greenness, density, and health. It is calculated as
(NIR - RED) / (NIR + RED). Healthy vegetation typically has NDVI values closer to +1 (dense, vigorous vegetation), while bare soil or water has values closer to 0 or negative. - Normalized Difference Red Edge Index (NDRE): NDRE combines Near-infrared (NIR) and Red Edge bands (
(NIR - RE) / (NIR + RE)). It is particularly useful for assessing chlorophyll content in mid to late-season crops and high-density canopies, providing insights into crop stress. - Soil Adjusted Vegetation Index (SAVI): SAVI is similar to NDVI but includes a soil brightness correction factor to improve accuracy in areas with low vegetation cover where soil reflectance can significantly influence readings.
- Green Normalized Difference Vegetation Index (GNDVI): This index uses the green wave to calculate chlorophyll content instead of red, often showing higher sensitivity to chlorophyll variation and a higher saturation point than NDVI, making it useful for crops with dense canopies or in more advanced development stages.
- Normalized Difference Water Index (NDWI): NDWI is sensitive to changes in the liquid water content of vegetation canopies and can be used to detect water stress.
The Workflow: From Data Collection to Interpretation
An effective vegetation health assessment using drone spectral imaging follows a structured workflow.
Planning the Drone Mission
Careful mission planning is crucial for acquiring high-quality data. This involves defining the area of interest, flight altitude, overlap between images, and considering environmental factors like solar angle and weather conditions to minimize errors.
Data Acquisition and Sensor Types
Drones are equipped with specialized multispectral or hyperspectral cameras. These sensors capture images in multiple, distinct spectral bands simultaneously. For example, a multispectral camera like the MicaSense Altum can capture 5 distinct wavelengths plus a thermal image.
Data Processing and Orthomosaicing
Once collected, the raw spectral images undergo several processing steps.
- Radiometric Calibration: This corrects for variations in lighting conditions and sensor performance, often using reflectance targets in the field.
- Orthomosaicing: Individual overlapping images are stitched together to create a single, georeferenced orthomosaic (a geometrically corrected aerial image map). Structure from Motion (SfM) software is commonly used for this, also generating 3D structural models like Digital Terrain Models (DTM) and Canopy Height Models (CHM).
- Spectral Index Calculation: From the orthomosaic, vegetation indices (like NDVI, NDRE) are calculated pixel by pixel based on the reflectance values in different spectral bands.
Analysis and Interpretation of Vegetation Indices
The generated vegetation index maps provide visual representations of plant health across the surveyed area. High NDVI values, for instance, correspond to vigorous, healthy vegetation, while lower values may indicate stress. Advanced analysis often involves machine learning algorithms to classify vegetation types, detect stress, or predict yields. Comparing data over time (multi-temporal analysis) can reveal changes in vegetation health, allowing for proactive intervention.
Applications and Benefits of Drone Spectral Imaging
The insights derived from drone spectral imaging have wide-ranging applications across various sectors.
Precision Agriculture
In agriculture, drones enable farmers to monitor crop health, identify nutrient deficiencies, detect water stress, and pinpoint pest infestations or diseases early. This allows for targeted application of fertilizers, pesticides, or irrigation, leading to improved crop yields, reduced resource waste, and more sustainable farming practices.
Forestry Management
Multispectral imagery is invaluable in forestry for mapping tree species, assessing forest health, monitoring the spread of diseases or pests, estimating timber volume, and tracking restoration project progress. Drones can efficiently cover large, often inaccessible forest areas, providing detailed data for sustainable management.
Environmental Monitoring
Beyond agriculture and forestry, drone spectral imaging is used for environmental applications such as mapping water quality, monitoring seaweed or seagrass biomass, assessing land degradation, and tracking changes in vegetation cover over time. It supports conservation efforts and helps manage natural resources more effectively.
Early Detection of Stress
One of the most significant benefits is the ability to detect vegetation stress before it becomes visible to the human eye. Changes in spectral reflectance, especially in the NIR and Red Edge bands, can signal problems like drought, disease, or nutrient deficiencies at an early stage, enabling timely interventions that can prevent significant damage and yield loss.
Challenges and Considerations
Despite its numerous advantages, implementing drone spectral imaging for vegetation health assessment comes with its own set of challenges.
Cost of Equipment
Multispectral and hyperspectral sensors can be expensive, and integrating them with drones, along with purchasing essential processing software, represents a significant initial investment.
Data Processing Expertise
The sheer volume and complexity of spectral data require specialized software and expertise for processing, analysis, and interpretation. Generating accurate orthomosaics and vegetation index maps demands a solid understanding of remote sensing principles and photogrammetry.
Environmental Factors
Factors such as varying solar angles, cloud cover, and atmospheric conditions can affect data quality and consistency. Radiometric calibration and careful flight planning are essential to mitigate these influences.
Regulatory Compliance
Operating drones requires adherence to local aviation regulations, which can vary significantly by region and type of operation. Obtaining necessary permits and ensuring safe flight practices are crucial considerations.
Conclusion
Drone spectral imaging has emerged as a transformative technology for assessing vegetation health, offering unparalleled precision, efficiency, and depth of insight. By harnessing the power of multispectral and hyperspectral sensors and leveraging advanced data processing techniques, professionals in agriculture, forestry, and environmental management can gain a comprehensive understanding of plant vigor and stress. While challenges related to cost, expertise, and environmental factors exist, the continuous advancements in drone technology and data analytics are making these powerful tools more accessible and effective, paving the way for more informed decision-making and sustainable resource management worldwide.