Precision agriculture is being revolutionized by advanced remote sensing technologies, with drone-derived Normalized Difference Vegetation Index (NDVI) maps emerging as an indispensable tool for modern farmers and agronomists. These maps provide critical insights into crop health and vigor, enabling data-driven decisions that optimize resource allocation, reduce waste, and ultimately enhance yields. By moving beyond traditional visual scouting, NDVI mapping offers an invisible glimpse into plant vitality, sometimes weeks before problems become apparent to the naked eye.
What is NDVI and How Does it Work?
The Normalized Difference Vegetation Index (NDVI) is a widely used remote sensing metric that quantifies vegetation health based on how plants reflect different wavelengths of the electromagnetic spectrum. At its core, NDVI leverages the unique reflective properties of healthy vegetation:
- Visible Red Light: Healthy plants, rich in chlorophyll, strongly absorb visible red light for photosynthesis.
- Near-Infrared (NIR) Light: Conversely, healthy plant cell structures reflect a high amount of near-infrared light.
Stressed, unhealthy, or sparse vegetation reflects more red light and less NIR. The NDVI formula calculates the difference between NIR and red light reflectance, normalized by their sum:
NDVI = (NIR – Red) / (NIR + Red)
This formula yields a value typically ranging from -1 to +1. Values closer to +1 indicate dense, healthy vegetation with high photosynthetic activity, while values near zero suggest minimal or unhealthy vegetation. Negative values often represent non-vegetated surfaces like water or bare soil. This characteristic interaction with light allows NDVI to act as a reliable indicator of vegetation density, biomass, chlorophyll levels, and overall vitality.
Why Drones for NDVI Mapping?
While satellite imagery has traditionally provided NDVI data, drones offer significant advantages, especially for precision agriculture applications:
Superior Spatial Resolution
Drones can capture NDVI imagery at much higher resolutions, often at the centimeter scale, compared to the meter or multi-meter resolution of most satellite imagery. This allows for detailed analysis of individual plants or small areas within a field, revealing subtle variations that satellites might miss.
Flexibility and Timeliness
Drones can be deployed on-demand, allowing farmers to collect data precisely when needed, such as during critical crop growth stages or after adverse weather events. This flexibility provides real-time or near real-time insights, which is crucial for timely interventions. Satellites, in contrast, have fixed revisit frequencies and can be hampered by cloud cover.
Greater Accessibility and Affordability for Localized Use
For smaller to medium-sized agricultural plots, drone-based NDVI surveys can be more cost-effective than obtaining high-resolution satellite imagery. As drone technology becomes more accessible, it makes advanced crop monitoring viable for a wider range of farm sizes.
How Drones Capture NDVI Data
The process of generating NDVI maps using drones involves several key steps:
Multispectral Sensors
Drones specifically used for NDVI mapping are equipped with multispectral cameras. Unlike standard RGB cameras that capture visible light (red, green, blue), multispectral sensors capture data across multiple narrow bands of the electromagnetic spectrum, crucially including visible red and near-infrared (NIR) light. Some systems may even use modified RGB cameras with NIR filters, though dedicated multispectral cameras generally offer higher performance and accuracy.
Flight Planning and Data Acquisition
To create comprehensive field maps, drones are programmed with mission planning software. These applications allow for automated flight paths to ensure uniform data collection over the target area. As the drone flies, the multispectral sensor captures numerous images in the red and NIR bands.
Image Processing and Map Generation
After data acquisition, the raw sensor data undergoes specialized processing:
- Radiometric Calibration: Images are calibrated to account for varying lighting conditions during the flight.
- Orthomosaic Creation: Individual images from each waveband (red and NIR) are stitched together to create seamless, georeferenced orthomosaic maps.
- NDVI Calculation: Specialized analytical tools and software then apply the NDVI formula to each pixel of the orthomosaics, generating NDVI values. These values are then translated into a color-coded map.
Interpreting NDVI Maps
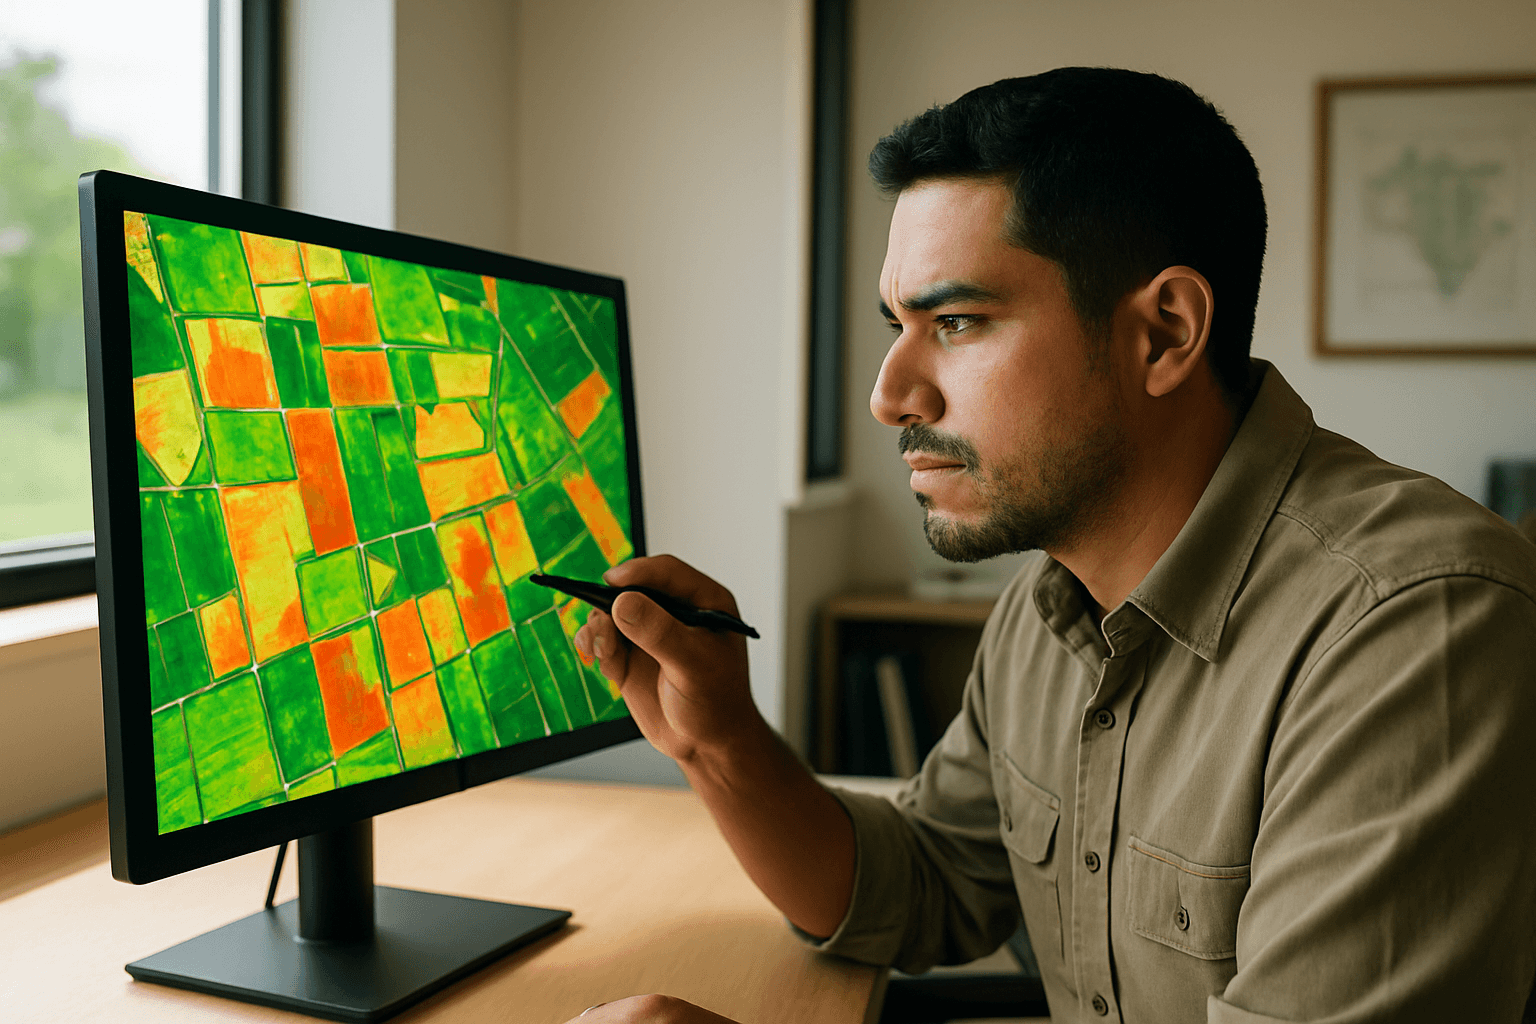
NDVI maps are typically presented as color-coded visualizations, making it intuitive to understand vegetation health variations across a field.
Understanding the Color Scale
While there’s no single universal color palette, the most popular and commonly understood scheme is often referred to as a “stoplight color map”:
- Deep Green (High NDVI values, typically 0.6 to +1): Indicates dense, healthy, and vigorous vegetation with high photosynthetic activity. This is generally the desired state for crops.
- Light Green to Yellow (Moderate NDVI values, typically 0.3 to 0.6): Suggests areas with moderate growth, potential stress, or sparse vegetation. These areas might be experiencing nutrient deficiencies, water stress, or early signs of disease.
- Red to Orange (Low NDVI values, typically 0 to 0.3): Represents unhealthy, stressed, or very sparse vegetation. In some contexts, this could indicate bare soil or dead vegetation.
- Negative Values (e.g., -1 to 0): Typically correspond to non-vegetated surfaces such as water bodies, bare soil, roads, or buildings.
Context is Key
Interpreting NDVI maps effectively requires considering the crop type, growth stage, and historical field data. For example, what is considered “healthy” NDVI can vary significantly between the early vegetative stage and the fruit development stage. Extremely high NDVI values in a mature crop could even indicate weed invasion rather than solely crop vigor.
Applications of NDVI Maps in Precision Agriculture
The insights gained from drone-based NDVI maps are highly valuable for a multitude of precision agriculture applications:
Early Detection of Crop Stress
NDVI can identify signs of stress or disease in crops days or even weeks before they are visible to the naked eye. Since crop stress often appears in the near-infrared spectrum first, NDVI allows for earlier detection of issues like nutrient deficiencies, water stress, pest infestations, or fungal infections. This enables timely intervention, preventing further damage and protecting yields.
Optimized Resource Allocation
NDVI maps pinpoint areas of varying plant health, allowing farmers to apply resources like water, fertilizers, and pesticides more efficiently and precisely. This targeted approach, often referred to as Variable Rate Application (VRA), reduces waste, lowers costs, and minimizes environmental impact by ensuring inputs are delivered only where and when they are needed.
- Irrigation Management: By identifying dry patches or areas with water stress, NDVI data guides irrigation decisions, conserving water and improving yield.
- Fertilization Optimization: NDVI maps highlight nutrient deficiencies, facilitating targeted fertilization and maximizing nutrient uptake by plants.
Crop Growth Monitoring and Yield Prediction
Continuous monitoring of NDVI values throughout the growing season provides detailed insights into crop development and vitality. By tracking changes over time, farmers can understand crop performance, identify patterns, and adjust management practices accordingly. NDVI values also correlate strongly with green biomass and crop yield, making them a valuable input for predicting harvest volumes with greater accuracy.
Identification of Underlying Field Issues
Consistently low NDVI values in the same areas over multiple crop cycles can signal deeper, persistent problems such as poor soil structure, drainage issues, or soil compaction. This diagnostic capability allows growers to address the root causes of underperformance rather than merely treating symptoms.
Limitations and Future Outlook
Despite their significant benefits, drone-based NDVI mapping has some limitations:
- Initial Investment and Expertise: The initial cost of drones with multispectral sensors and the need for technical expertise in operation and data analysis can be barriers.
- Coverage Area and Battery Life: Drones have limited flight range and battery life, meaning large fields may require multiple flights and battery changes, which can be time-consuming.
- NDVI Saturation: At very high biomass densities (e.g., a fully canopied crop), NDVI can “saturate,” meaning it may reach its maximum value (close to +1) and no longer accurately reflect increasing vigor. Other vegetation indices, such as EVI (Enhanced Vegetation Index) or SAVI (Soil Adjusted Vegetation Index), may offer better insights in such scenarios.
- Soil Noise Effect: In early growth stages with sparse vegetation, exposed soil can influence NDVI readings.
However, the future of NDVI drone technology in agriculture is bright. Ongoing advancements in multispectral sensors, AI, and data analytics are leading to more sophisticated and user-friendly systems. Integration with other agricultural technologies promises even greater efficiencies and sustainability, transforming agriculture towards unparalleled productivity and climate resilience. As these technologies evolve, drone-based NDVI mapping will continue to empower farmers with the precision insights needed to thrive in a demanding agricultural landscape.